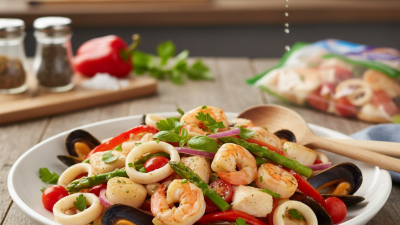
What Are China Top 10 Frozen Seafood Mix Suppliers?
China’s frozen seafood sector has grown into a complex sourcing market. Buyers can find shrimp, squid, mussels, fish fillets, and mixed packs from many regions. Yet product photos rarely reveal the full supply-chain story.
This guide examines China’s top 10 Frozen Seafood Mix suppliers through practical purchasing criteria. We consider product variety, raw-material origin, processing capacity, cold-chain control, certifications, packaging, and export experience. We also examine IQF technology, glazing ratios, allergen management, and traceability records. These details matter when a mixed seafood pack reaches a restaurant kitchen or retail freezer.
Barton Seaver, a chef and seafood sustainability advocate, has said, “Seafood is the last wild food we eat.” His observation highlights an important responsibility. A supplier must provide more than attractive pricing. It should explain species composition, harvest areas, processing dates, storage temperatures, and testing procedures.
The ranking is not flawless. Supplier information can change quickly. Public certifications may also require independent verification. Therefore, this overview should support due diligence rather than replace it. Buyers should request current certificates, product specifications, samples, and audit documents before signing contracts. Small differences can affect yield, flavor, and customer trust. A bag containing uneven cuts may create avoidable waste. Excessive ice glazing can reduce usable weight. Weak labeling can complicate allergen control.
The selected companies are presented for comparison, not unconditional approval. Their strengths may differ across hospitality, retail, foodservice, and international distribution. Careful buyers should test consistency over several shipments. That practical step often reveals more than a polished brochure.
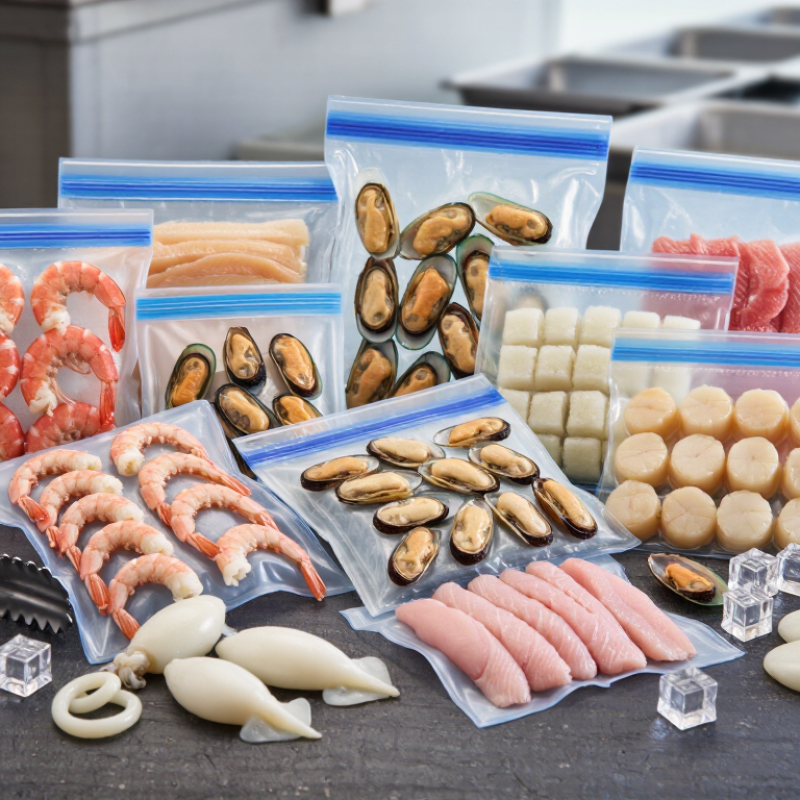
China’s Frozen Seafood Mix Market: FAO SOFIA 2024 Baseline Data
China’s frozen seafood mix market should be read against the FAO SOFIA 2024 baseline. The report records 185.4 million tonnes of global fisheries and aquaculture production in 2022. Aquaculture supplied more than half of aquatic animal production for the first time. China contributed about 36% of global aquatic animal output, supported by extensive farming and processing capacity.
These figures matter when assessing China’s top 10 frozen seafood mix suppliers. A credible supplier should show cold-chain control, species-level traceability, and stable export documentation. FAO also reports that aquatic foods supplied approximately 20.7 kilograms per person globally in 2022. This demand supports mixed packs containing shrimp, squid, fish fillets, and shellfish. However, a market-share ranking alone can mislead. Production volume does not prove uniform quality.
The FAO data measures national production, not every frozen product category. That limitation deserves attention. Buyers should compare freezing temperature records, glazing ratios, laboratory testing, and seasonal sourcing details. The OECD-FAO Agricultural Outlook 2024–2033 also anticipates continued growth in aquatic food consumption, although trade and climate risks may affect supply. In practical terms, a reliable supplier needs more than a large catalogue. It needs repeatable specifications, responsive quality control, and evidence that survives an audit. Mistakes still occur. Product descriptions can also hide meaningful differences in cut size and net weight.
Defining Top Suppliers with China Customs 2023 Export Metrics
What makes China’s top frozen seafood mix suppliers credible? The answer should begin with measurable export performance, not catalog size or search visibility. China Customs 2023 statistics provide the strongest public reference for export value, quantity, destination, and tariff classification. However, “frozen seafood mix” has no single universal HS code. Products may appear under frozen fish, crustaceans, molluscs, or prepared seafood categories.
A practical ranking should screen customs records across relevant HS codes, then compare shipment value, net weight, average export price, and destination coverage. A supplier shipping 8,000 tonnes may deserve attention, but unusually low unit prices require careful review. They could reflect different species, packaging formats, or incomplete product descriptions. The FAO State of World Fisheries and Aquaculture 2024 report highlights continuing growth in aquatic food trade, while UN Comtrade supports cross-checking China’s export values with importing-country records.
Customs data alone cannot prove factory capability. Public Chinese customs statistics usually present aggregated trade results rather than a complete supplier league table. Reliable due diligence should combine 2023 customs metrics with processing certificates, cold-chain records, audit results, and recent shipment consistency. Frozen seafood mix should also be examined at carton level: species names, glazing percentage, net weight, temperature records, and declared origin matter. A ranking based only on export value is convenient, but incomplete. That weakness deserves attention.
Top 10 Suppliers Ranked by Export Value, Capacity, and Product Range
China’s top 10 frozen seafood mix suppliers should be assessed through measurable export value, processing capacity, and product range. China Customs data places national aquatic-product exports at roughly US$20.6 billion in 2023. However, this figure covers many product categories, not only frozen seafood mixes.
A practical ranking can weight export value at 40%, verified capacity at 35%, and product range at 25%.
UN Comtrade records under HS 0303 and HS 0306 help compare frozen fish and crustacean shipments.
Capacity should reflect audited annual throughput, cold-storage volume, and blast-freezing lines. Advertised capacity is not always reliable. That deserves caution.
Product-range scores should consider shrimp, squid, mussels, fish fillets, and mixed packs. The strongest suppliers usually provide multiple glazing levels, pack sizes, and private-label formats. FAO’s SOFIA 2024 report recorded global aquatic animal production of about 185 million tonnes in 2022, showing the scale of this supply chain.
Buyers should also verify HACCP systems, ISO 22000 certification, lot traceability, and temperature records below -18°C.
Independent audits matter.
A supplier with high exports may still offer limited customization. Another may have broad products but weak delivery history. Therefore, the top ten ranking should combine customs data, factory evidence, inspection records, and recent shipment performance, rather than relying on catalog claims alone.
Supplier Profiles: Species Mix, Certifications, and Export Markets
A practical top-ten shortlist should compare more than price and catalogue size. Frozen seafood mix suppliers commonly combine shrimp, squid, mussels, whitefish, and surimi. The mix matters because species substitution can disrupt menus and margins. FAO’s SOFIA 2024 report recorded 185 million tonnes of global aquatic animal production in 2022. It also reported that 89% was used for human consumption. That demand increases the value of dependable cold-chain management.
Supplier profiles should show harvest origin, processing location, and pack format. Strong candidates provide HACCP-based controls, ISO 22000 systems, and third-party audits. MSC or ASC certification may support responsibly sourced wild or farmed species. BRCGS and IFS certification can strengthen retailer acceptance. Yet certificates alone prove little. Buyers should check recent audit dates, lot-level traceability, glazing percentages, and temperature records. Small details matter.
Export-market coverage separates the leading suppliers. Some serve East Asian foodservice markets with squid, shrimp, and mixed hotpot packs. Others focus on European retail, where allergen declarations and sustainability evidence receive closer review. North American buyers often expect FDA-aligned documentation and consistent carton labeling. UN Comtrade data shows seafood trade remains highly international, but trade values vary sharply by species and processing level. The ranking is not perfectly objective. Freight costs, seasonal landings, and rejected lots can quickly change it. A supplier may look impressive on paper, yet perform poorly during a delayed container.
Comparing MOQ, Cold-Chain Coverage, Prices, and Delivery Performance
When comparing China’s top 10 frozen seafood mix suppliers, MOQ often shapes the real purchase cost. Smaller buyers may find 500 kilograms manageable, while larger distributors can negotiate orders above five metric tons. Yet MOQ alone can mislead. A low threshold may reflect limited product variety or weaker production planning. Request recent batch records, packing photos, and size specifications before comparing quotations.
Cold-chain coverage deserves closer attention. Reliable suppliers should explain factory storage temperatures, loading procedures, reefer routes, and delivery handover points. Product temperature should normally remain near -18°C, with clear inspection records during transit. Prices commonly change with species, glazing percentage, packaging format, and seasonal supply. A cheaper quote can hide heavier ice glazing or inconsistent cut sizes. Ask for a landed-cost calculation, not only a factory price.
Delivery performance is best measured through evidence. Review the last six to twelve shipments, including on-time rates, temperature deviations, customs delays, and replacement handling. Some suppliers promise seven-day dispatch but depend on crowded ports or limited reefer capacity. That weakness matters. I would also test one pilot order before signing a large contract. My comparison would score MOQ flexibility, cold-chain visibility, price stability, and delivery reliability separately. No supplier performs perfectly across all four areas. Bulk pricing may improve, while responsiveness becomes slower.